Thursday, May 13, 2010
Highway Data Revised
Last year I plotted FHWA VMT divided by total gasoline consumed in the US from January 2000 to November 2009. There was a clear downward trend. This year the data was revised. I'm now very skeptical about FHWA research.
April 2009 data:

May 2010 data:

UPDATE: From FHWA, Previous numbers are TVT estimates. States submit after 6 months and frequently resubmit data and update data. The final (HPMS) numbers are published a year and half later. This year's data for 2007, 2008, and 2009 were largely higher than TVT estimates. Upward revision is normal, but this year's was larger than usual. I wouldn't be suprised if the drive for stimulus dollars has pushed the numbers up.

April 2009 data:

May 2010 data:
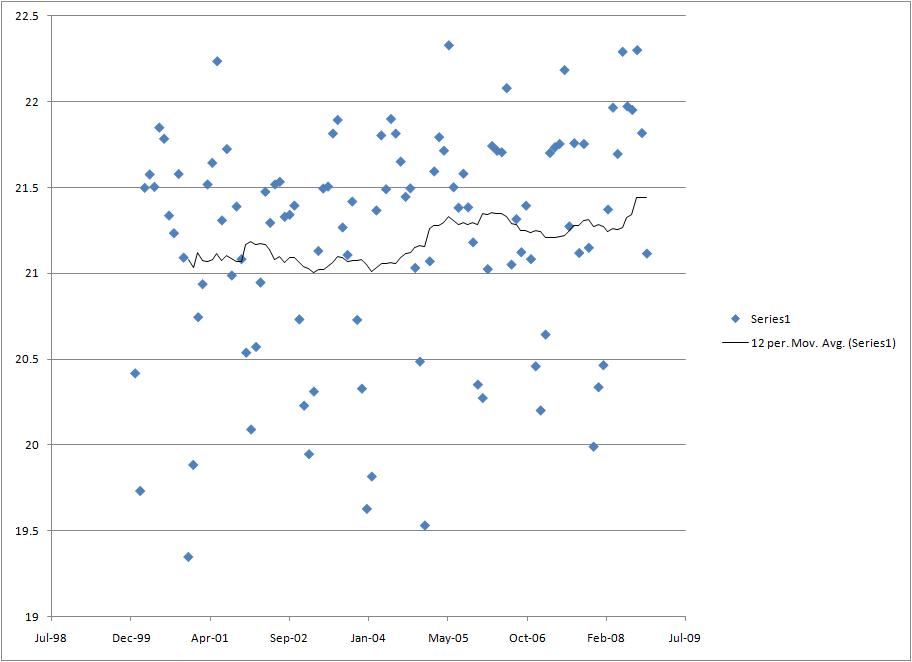
UPDATE: From FHWA, Previous numbers are TVT estimates. States submit after 6 months and frequently resubmit data and update data. The final (HPMS) numbers are published a year and half later. This year's data for 2007, 2008, and 2009 were largely higher than TVT estimates. Upward revision is normal, but this year's was larger than usual. I wouldn't be suprised if the drive for stimulus dollars has pushed the numbers up.

![]()